CultureThe good news
Sovico celebrates its renewed library, with books and games
The 24 October inauguration celebrated the Salvatore Quasimodo library. A limited service had already resumed in September.

AI illustration · Positive Times · ImageGen
From the archive: the edition of , with the original dates and sources for every story. Read the latest edition.
Music for today ·The 24 October inauguration celebrated the Salvatore Quasimodo library. A limited service had already resumed in September.
AI illustration · Positive Times · ImageGen
A satellite story published on 26 October compares colours earlier in the month, while distinguishing forests, crops and clouds.
The contribution to the Nature Investment Facility will support programmes in Africa and South-East Asia. Environmental outcomes remain to be verified.
AI illustration · Positive Times · ImageGen
A national meeting examined what reliable services need. WHO reports gaps and recommendations, rather than newly completed facilities.
AI illustration · Positive Times · ImageGen
The council estimates around 2,500 visitors over the completed Archeodromo’s opening weekend, bringing archaeological research into contact with the public.
AI illustration · Positive Times · ImageGen
Rho inaugurated the Parco Ritrovato on 24 October, with walking and cycling routes, a teaching garden and protected road crossings.
Photo · Comune di Rho · CC BY 4.0
The Community Seed Fund application window runs from 26 October to 4 December 2026, alongside the county’s nature recovery strategy.
AI illustration · Positive Times · ImageGen
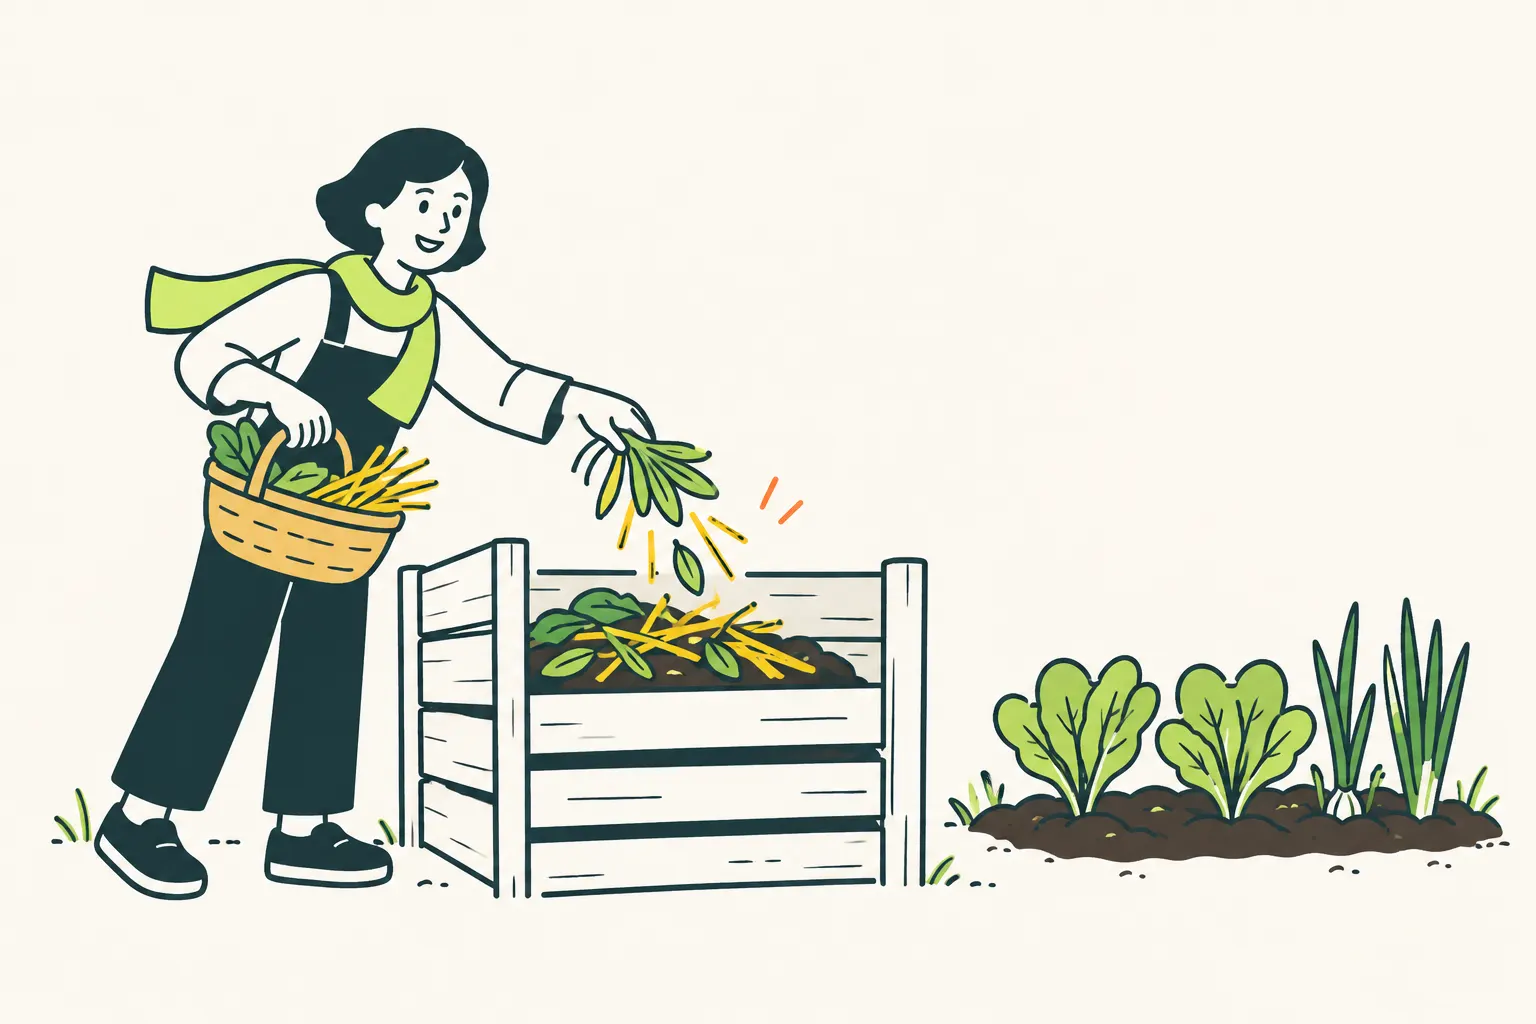
FAO follows Nana Nikuradze’s practical training and first compost production in 2026, keeping future ambitions separate from achievements.
AI illustration · Positive Times · ImageGen
Design · Philosophy · Plants · Curiosities · Words · Food · Cultures & peoples. Ideas worth a closer look.

Air Chair reveals how a manufacturing technique can shape an everyday object without turning the finished design into a spectacle.
Read the full story
Ruskin’s phrase shifts attention from owning to living: which possibilities make the things we produce genuinely useful to people?
Read the full story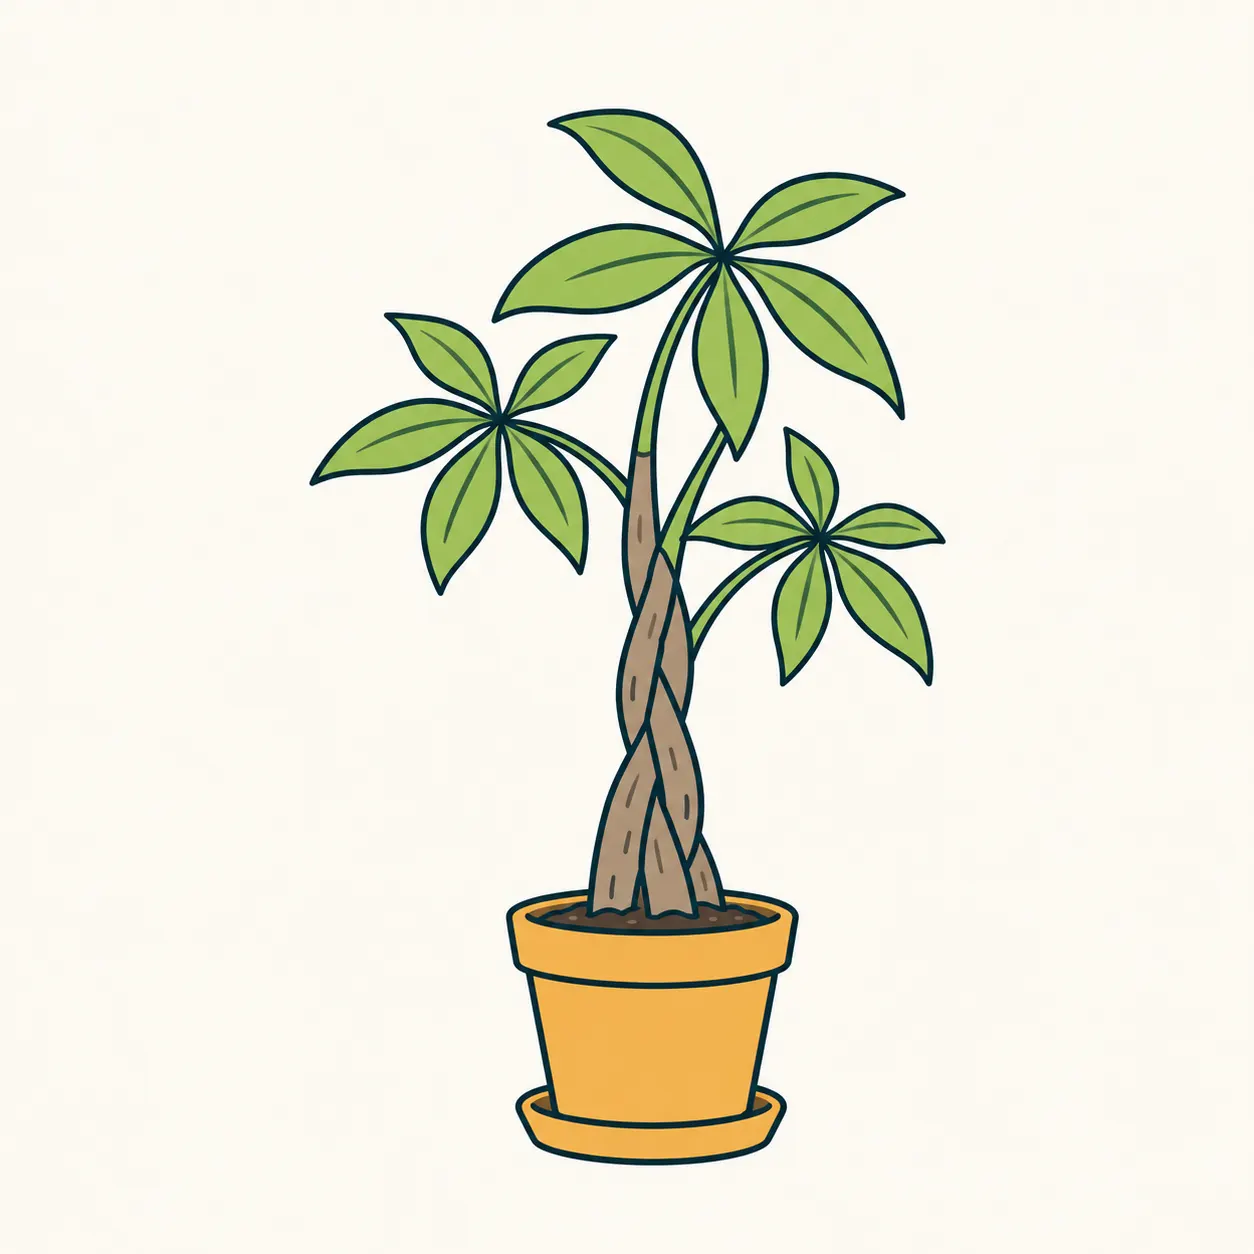
The braided trunk of a Pachira comes from cultivation: looking at its leaves helps separate the plant from its presentation.
Read the full story
A handrail seems to leave its own signature. Chemistry instead reveals an encounter between the metal and our skin.
Read the full story
The Italian word scrupolo connects an uneasy doubt with careful attention; its documented history begins with a tiny stone.
Read the full story
Saffron threads are a precise part of a flower: following their journey reveals the work behind a very small quantity.
Read the full story
In Ukrainian egg decoration, wax protects parts of the shell; a patient technique stays alive through the people who practise it.
Read the full storyOriginal illustrations made with AI assistance. Facts and sources stay in plain sight.
 Enlarge the chart
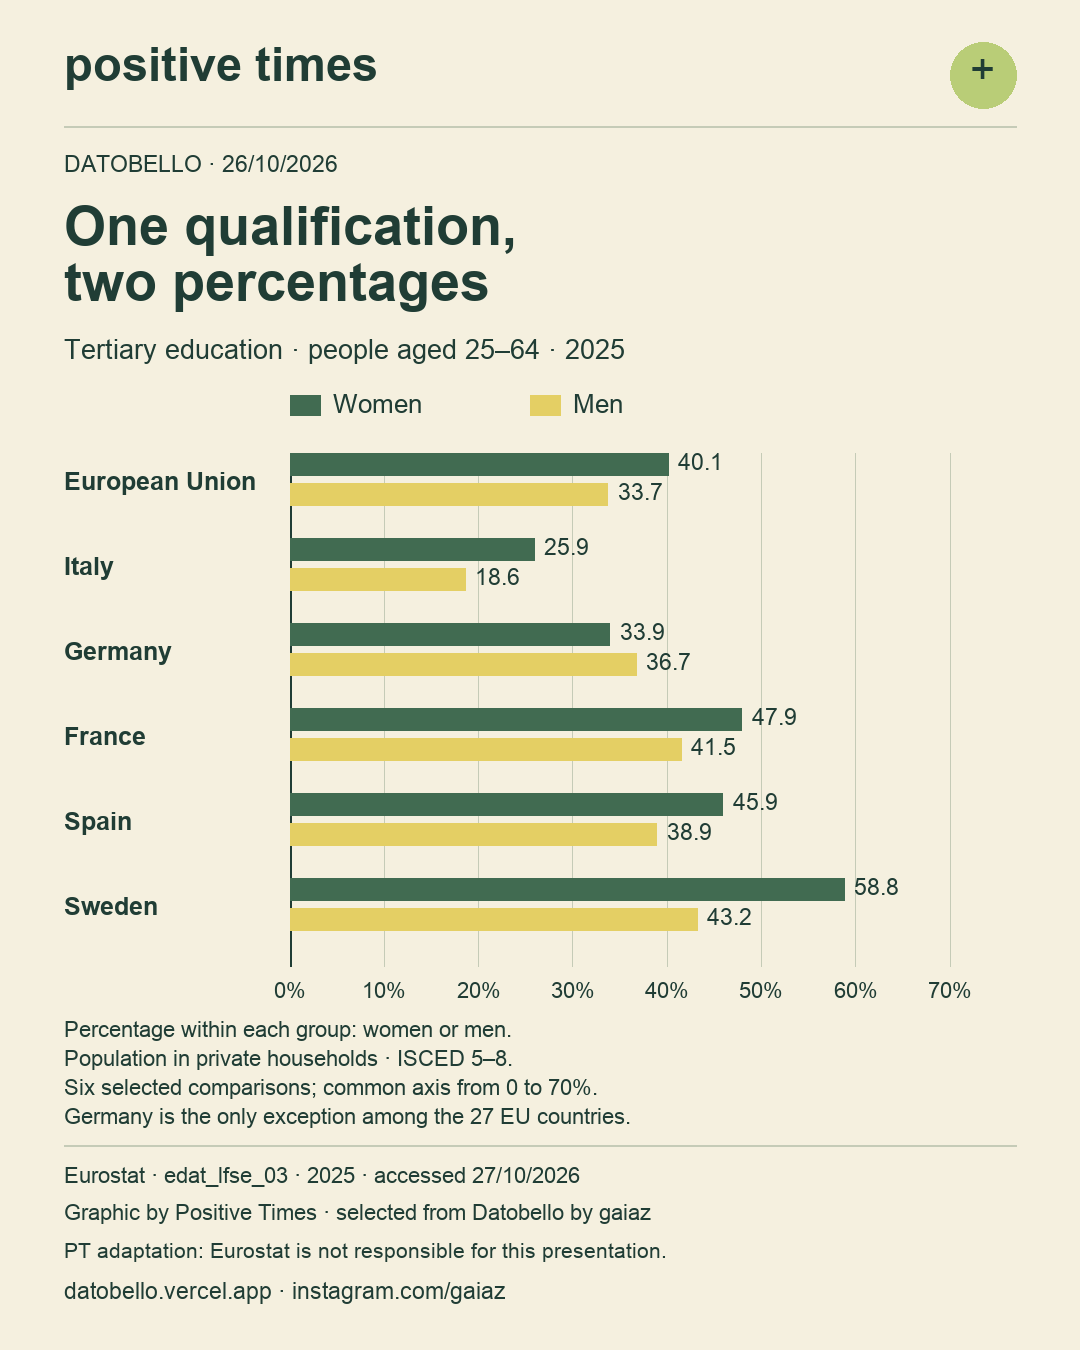
In 2025, 40.1% of women and 33.7% of men aged 25–64 in the European Union had completed tertiary education. In Italy, the shares were 25.9% and 18.6%; in Germany, 33.9% and 36.7%. Comparing all 27 member states shows that Germany was the only one with a higher male than female share. The chart presents six selected comparisons, including the EU aggregate. [1]
Each percentage refers to its own age and sex group in the population living in private households: it does not describe the composition of a single year’s graduates. “Tertiary” covers ISCED levels 5–8, from short-cycle higher education to doctorates. The figures come from the European Labour Force Survey and annual averages; these differences alone do not explain causes, course quality or employment opportunities. Adaptation and translations by Positive Times: Eurostat is not responsible for this presentation. [2]
A project by gaiaz · Instagram
That is quite a lot of good for one day.
Browse the other editions